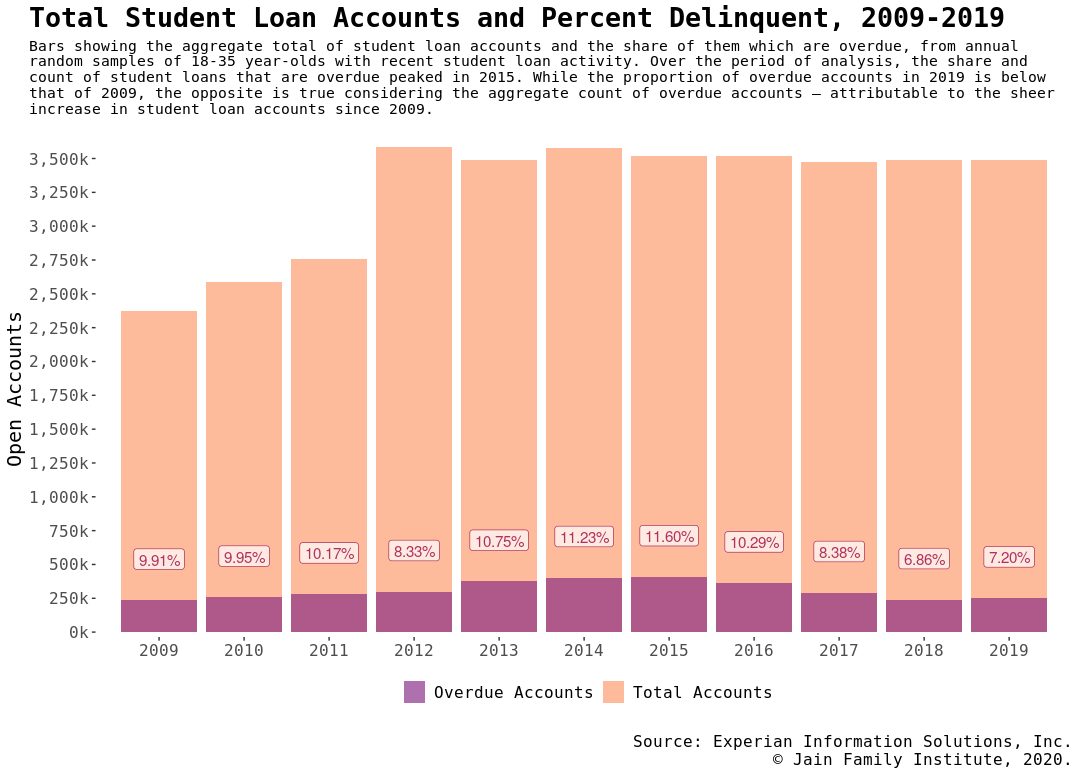
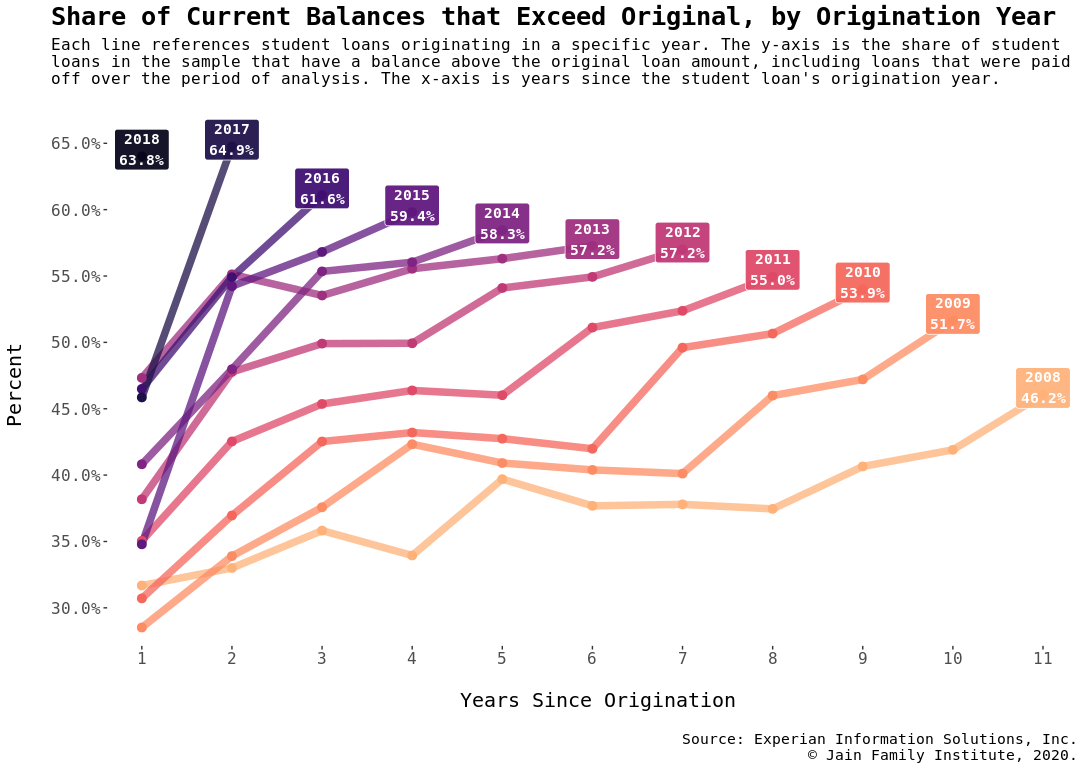
Student loan debt now stands at over $1.6 trillion according to estimates released this month by the Federal Reserve, a 75% increase from 10 years ago. Since the Great Recession, both average balances and the number of borrowers have consistently increased across the board. As more borrowers accumulate more debt, they increasingly cannot pay it off. Student debt balances have the character of filling a bathtub in which the drain is blocked.
This map and its accompanying in-depth analysis focus on the age group that is suffering the most from the student debt crisis—young adults aged 18–35. By examining the interaction between student loan balances, geography, income, and tuition, we seek to demystify the crisis and the year-over-year trends post-recession to 2019. To see more work from our Millennial Student Debt series, check out our MSD landing page.
Click on an area to freeze the informational panel and explore the statistics and institutions for that zip. Happy mapping!
ZCTA
Congressional Districts
Comparisons
?
Public
Private not-for-profit
Private for-profit
Bachelor Degree
Associate Degree
Below Associate Degree
Schools appear at higher zoom levels.
✖
?
Public
Private not-for-profit
Private for-profit
Bachelor Degree
Associate Degree
Below Associate Degree
Schools appear at higher zoom levels.
✖
Summary Statistics
Between the 2008–09 and 2018–19 academic years, the higher education industry has undergone major changes: the wave of post-recession enrollment, a boom and bust of for-profit institutions, traditional not-for-profit higher ed adopting for-profit business strategies, and a funding crisis coupled with bloating costs borne by students and increasing enrollment concentration across schools. As these shifts unfolded, the volume of student debt ballooned from $675 billion at the end of 2008 to over $1.6 trillion in 2019.
We have compiled data on most of these issues and summarized key statistics below. Higher education institutional summary statistics look at trends in the country for schools that have physical campuses as sourced from the Integrated Postsecondary Education Data System (IPEDS). Zip-level summary statistics look at trends across the country in income, indebtedness, and institutional choice. Student loan data is sourced from a repeated cross-sectional credit archive sample on 18–35 year-olds with student loan activity conducted by Experian Information Solutions, Inc. Income and population statistics are sourced from the American Community Survey. Concentration, enrollment, and school prices at the ZCTA-level are calculated according to 45 minute commuting distances. All tables are reproducible with the data that’s available for download.
Student Debt by State - how does your state fare against others?
Student debt samples were grouped to common census tracts, appended to demographic data, and then aggregated to state-level.
This analysis uses school-reported Integrated Postsecondary Education Data System (IPEDS) data from the final releases for the academic years of 2008–09 to 2017–18, and from the provisional release for the academic year 2018–2019. For median income and population estimates, we used data from the American Community Survey. For young-adult student debt balances, we used Experian’s consumer credit archives. School isochrone creation for all driving distances was made using OpenStreetMap. Mapping was done with MapBox and the US Census Bureau’s 2018 TIGER/Line Shapefiles. For institutions in the 2008–2009 years as well as all branch campuses, latitudinal and longitudinal coordinates were determined using Geocod.io. Median income, school prices, and debt values were adjusted to 2019 dollars using the Federal Reserve Consumer Price Index (all items) data.
The academic years represented here are from 2008–2009 to 2018–2019. For more information on the implications of the map and our preliminary findings, read our report here. Below, find explanations of all variables.
Variables derived for each ZCTA:
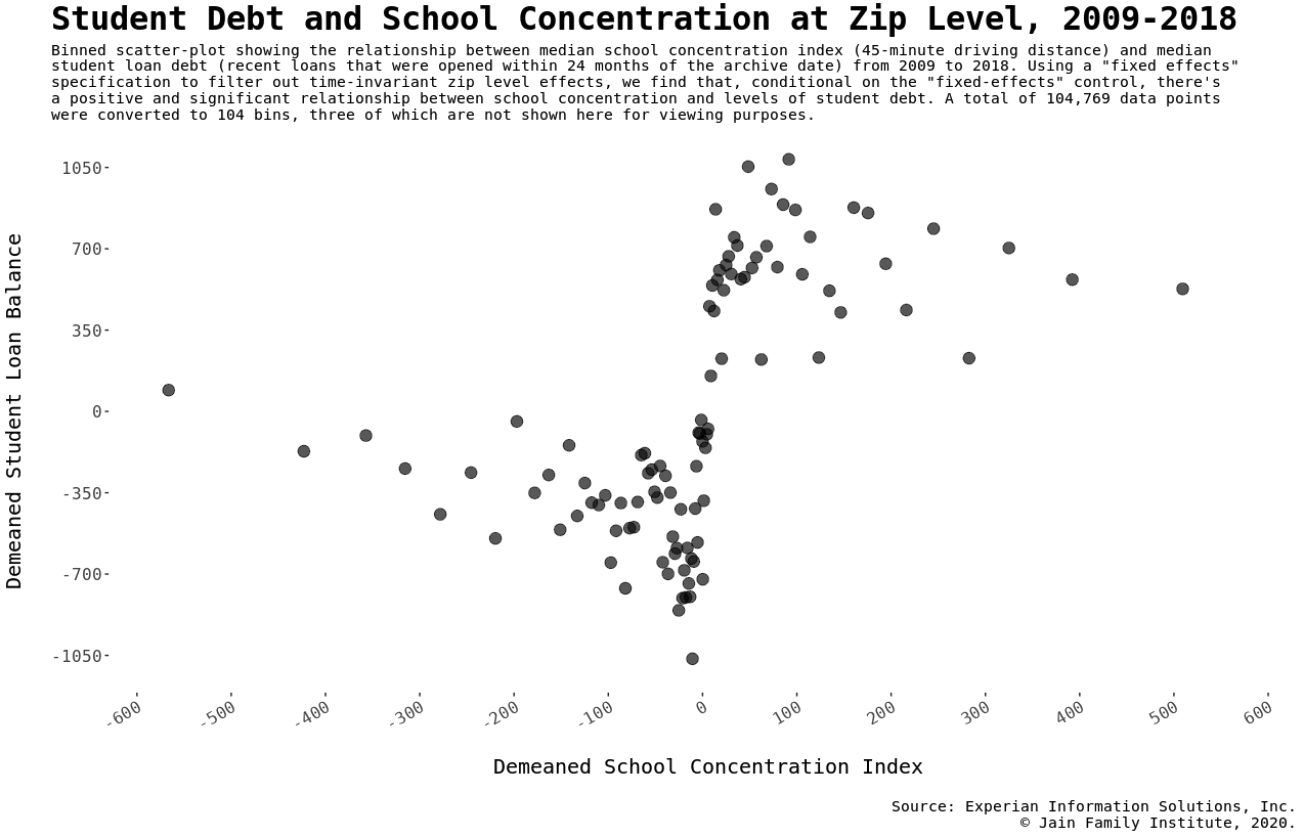
School Concentration Index (SCI) - We modeled the calculation of the SCI based on the Herfindahl-Hirschman Index (HHI). The HHI calculates market share for a particular company within a particular market; we calculate enrollment share for a particular school in a particular zip code tabulation area. SCI ranges from 0 (perfect competition) to 10,000 (complete monopoly). A SCI of 10,000 indicates one school accounts for all the enrollment for that ZCTA.
Every ZCTA has a unique School Concentration Index where \(n\) number of schools in each SCI equals the amount of schools where it is possible to drive to the associated ZCTA within 30, 45, or 60 minutes, depending on the selected map view. Each \(s_n\) is the undergraduate enrollment share of a school within the geographic area, expressed as a whole number rather than a fraction.
Number of Schools - The number of schools displayed for each ZCTA is a tally of the schools considered within a 30, 45, or 60 minute drive from at least a subsection of the ZCTA. The Number of schools variable takes a whole number.
Enrollment - The enrollment displayed for each ZCTA is the summation of the enrollment for every school considered within a 30, 45, or 60 minute drive from at least a subsection of the ZCTA. The Enrollment variable takes a whole number and is sourced from IPEDS 12-Month Enrollment Table. This number indicates how many unduplicated undergraduate individuals enrolled for credit the institution served over a 12 month period, regardless of when the individual enrolled.
25 Mile Zone Population Estimate - In place of population estimates for individual ZCTA, we list the summation of all the population estimates for the ZCTAs within 25 miles of the selected area; the purpose being to complement the zone-type scale used for the SCI. The 25 mile population zone originates from the mathematical centroid of each ZCTA.
Every ZCTA has a unique 25 Mile Zone Population Estimate where \(n\) number of ZCTAs in each ZCTA-zone equals the ZCTAs accessible to the root ZCTA within 25 miles. Each \(\text{pop}_n\) is the population estimate for that specific ZCTA. Both \(\text{pop}_n\) and \(\text{Pop}_{\text{ZCTA-ZONE}}\) take a whole number.
Average Net Price - Average Net Price is the average total cost of attending minus the average amount of federal, state or local government, or institutional grant and scholarship aid. Total cost of attendance is the sum of tuition, required fees, books and supplies, and the weighted average of room and board and other expenses. The value displayed for each ZCTA is the mean of the average net price of each school considered within a 30, 45, or 60 minute drive from at least a subsection of the ZCTA, weighted by the enrollment number of each school. The average net price per school is the average of the following variables sourced from IPEDS: NPIS412, NPIS422, NPIS432, NPIS442, NPIS452, NPT412, NPT422, NPT432, NPT442, NPT452. These variables from IPEDS show the average price of attendance for full-time, first-time degree/certificate-seeking undergraduates paying the in-state or in-district tuition rate who were awarded title IV federal student aid by varying degrees of student income level. All average net price values have been adjusted for inflation using the consumer price index (CPI) deflator and are in 2019 US dollars.
Average Tuition and Fees - Average Tuition and Fees is the mean published tuition and fees of each school considered within a 30, 45, or 60 minute drive from at least a subsection of the ZCTA, weighted by the enrollment number of each school. This is derived from each school’s published tuition and fees, for the given academic year, for academic year reporters only. Price of attendance for full-time, first-time undergraduate students for the FULL ACADEMIC YEAR: (Tuition and fees are those amounts used by your financial aid office for determining eligibility for student financial assistance) These data are published at the IPEDS College Navigator Web site.
Clear-cut variables per ZCTA:
Zip Code Tabulation Area - (Via the US Census Bureau) ZCTAs are generalized areal representations of United States Postal Service ZIP Code service areas.
Institution Name - These names are sourced from the IPEDS Institutional Characteristics table. It represents the Institution or Entity Name.
Map Name - The institution name plus the name of the campus / branch of that institution. The Map Name will equal Institution Name if the institution has only one campus / branch.
Level of Institution - Level of Institutions are sourced from the IPEDS Institutional Characteristics table. A classification of whether an institution’s programs are 4-year or higher (4 year aka Bachelors), 2-but-less-than 4-year (2 year aka Associates), or less than 2-years (aka Below Associate).
Control of Institution - Control of Institutions and definitions are sourced from the IPEDS Institutional Characteristics table. A classification of whether an institution is operated by publicly elected or appointed officials or by privately elected or appointed officials and derives its major source of funds from private sources.
Public institution - An educational institution whose programs and activities are operated by publicly elected or appointed school officials and which is supported primarily by public funds.
Private not-for-profit institution - A private institution in which the individual(s) or agency in control receives no compensation, other than wages, rent, or other expenses for the assumption of risk. These include both independent not-for-profit schools and those affiliated with a religious organization.
Private for-profit institution - A private institution in which the individual(s) or agency in control receives compensation other than wages, rent, or other expenses for the assumption of risk.
Population Estimate -
For academic years 2010–2011 to 2017–2018: Estimate; American Community Survey 5-year Estimates for the Total Population of the ZCTA (or Congressional District). Data are based on a sample and are subject to sampling variability. Population Estimates are not available for US Territories besides Puerto Rico.
For academic years 2008-2009 and 2009-2010: Estimate; American Community Survey 5-year Estimates for the Total Population of Census tract (or Congressional District). Utilized the U.S. Department of Housing and Urban Development (HUD) United States Postal Service ZIP Code Crosswalk Files (Tract to ZIP) to estimate Total Population of ZCTA by summing the product of the Census tract total population and the residential ratio for each ZIP code associated with that Census tract.
Median Income Estimate -
For academic years 2010–2011 to 2017–2018: Estimate; American Community Survey 5-year Estimates for the Median household income in the past 12 months (2019 inflation-adjusted dollars) of the ZCTA (or Congressional District). If a ZCTA does not have a Median Income listed, this indicates that either no sample observations or too few sample observations were available to compute an estimate. Data are based on a sample and are subject to sampling variability. Median Income Estimates are not available for US Territories besides Puerto Rico.
For academic years 2008–2009 and 2009–2010: Estimate; American Community Survey 5-year Estimates for the Median household income in the past 12 months (2019 inflation-adjusted dollars) of the US Census tract. We then utilized the U.S. Department of Housing and Urban Development (HUD) United States Postal Service ZIP Code Crosswalk Files (Tract to ZIP) to estimate the Median Income of each ZCTA by obtaining the weighted average of the product of the Census tract median income and the residential ratio for each ZIP code associated with that Census tract.
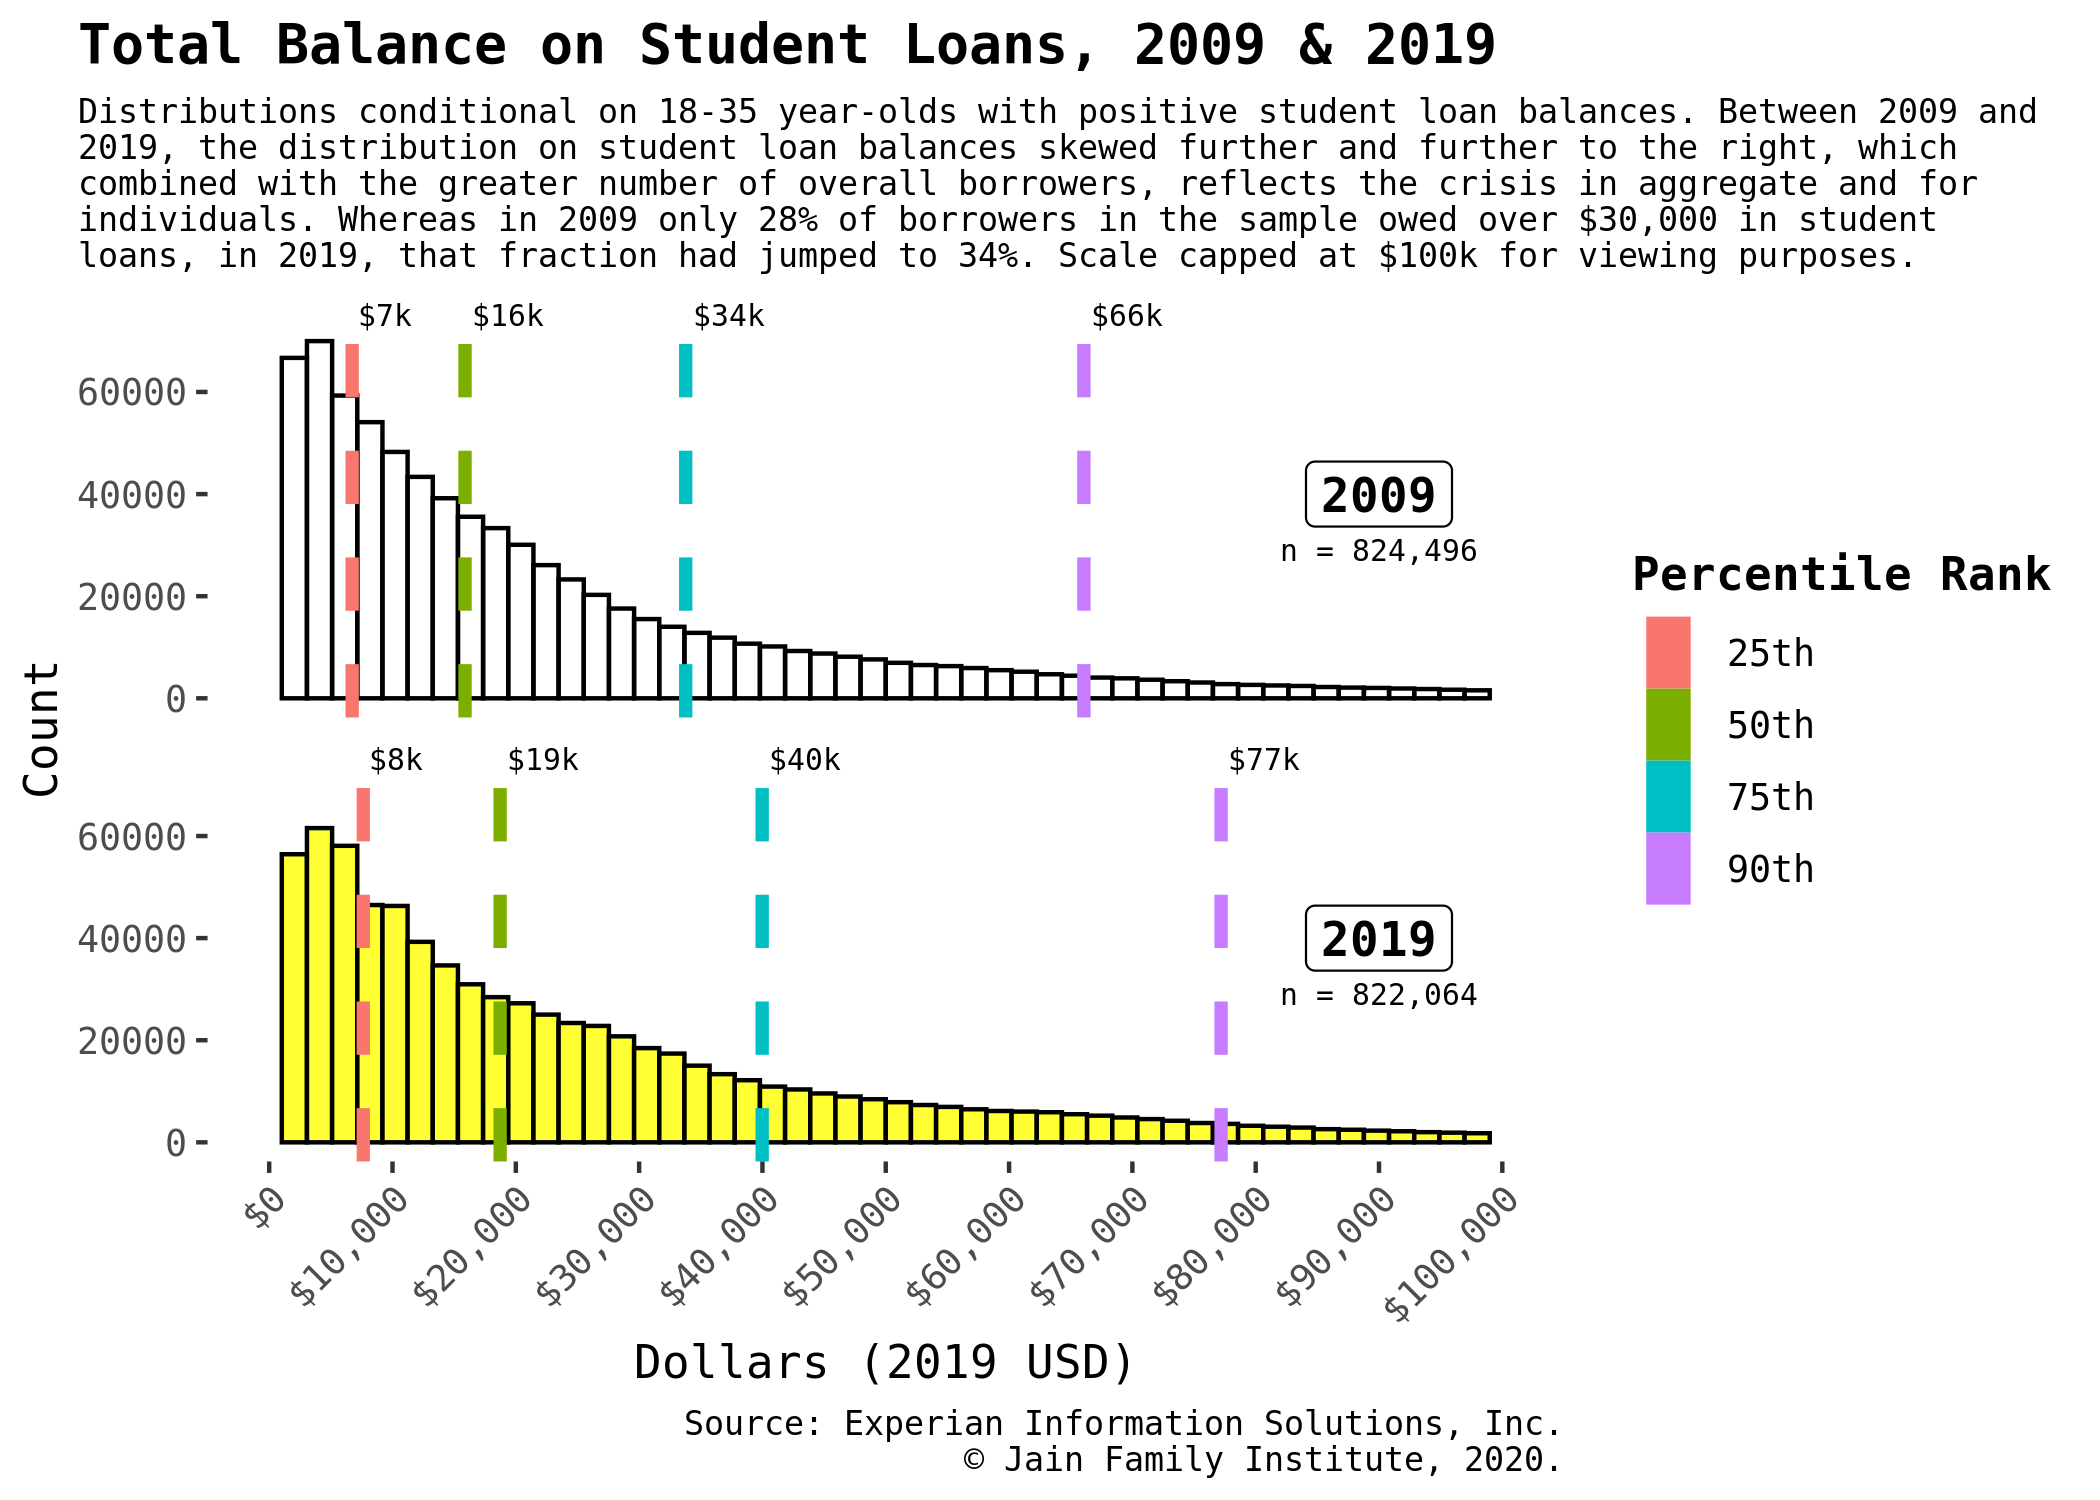
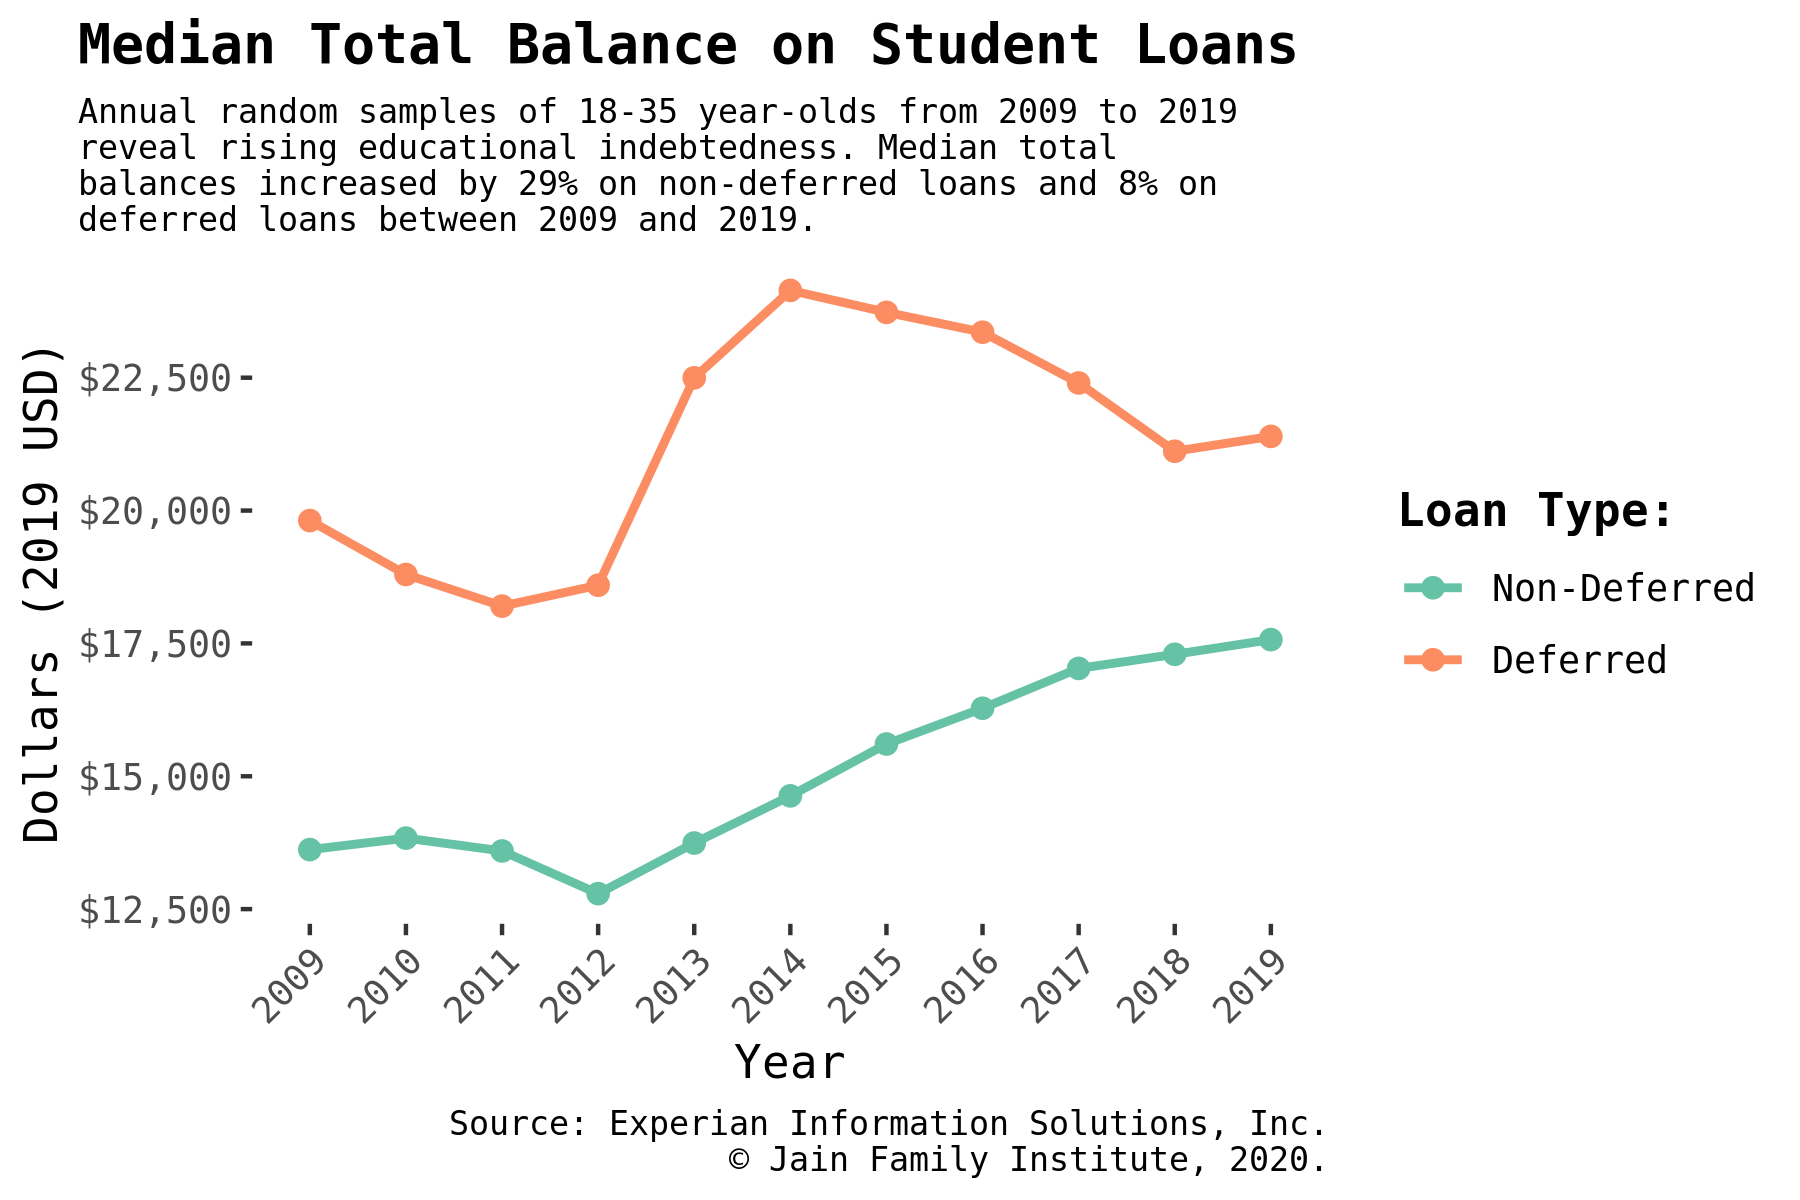
Median Total Balance for Student Loan Borrowers aged 18–35 - This estimate represents the ZCTA’s (or Congressional District’s) median per-person balance (2019 inflation-adjusted dollars) on total (deferred plus non-deferred) student loan debt in the particular year, conditional on an individual being aged 18–35 and having a positive non-zero student loan balance.
The estimate is sourced from a cross-sectional credit archive sample by Experian Information Solutions of one million 18–35 years old with recent student loan activity; for each year from 2009 to 2019, the million-person sample was randomly selected at the end of June. If a zip has missing data for a particular year it means that there were not enough sampled individuals to create a zip-level estimate.
Exclusion Criteria:
We excluded schools that offered exclusively advanced degrees, exclusively distance learning degrees, and schools where level and control of institution were unknown. Also excluded were administrative offices of institutions when the institution itself was counted separately, as located. If a school offered a bachelors or higher degree but no degree below bachelors, the graduate to undergraduate student ratio was over 10, and the undergraduate enrollment was below 100, the school was excluded. For public schools, driving distances were restricted to the state where the school resides.
In regards to branch campuses: IPEDS does not require institutions to report data separately for branch campuses. We parsed through websites of over 400 colleges with high likelihoods of having branch campuses. If you suspect an error on our map or missing data, please do not hesitate to contact us. More on how IPEDS data is reported: According to the IPEDS handbook,
All institutions in the U.S. and other U.S. jurisdictions that have a Program Participation Agreement (PPA) with the U.S. Department of Education to participate in Title IV federal student financial aid programs are required to report data to IPEDS, and are listed as separate entities in IPEDS. These entities are considered the "main campus."
Additionally,
The IPEDS definition of a branch campus is "a campus or site of an educational institution that is not temporary, is located in a community beyond a reasonable commuting distance from its parent institution, and offers full programs of study, not just courses."
The main campus and each additional location on the PPA are listed separately in IPEDS, and report their own data.
The main campus reports combined data for itself and any additional locations that are not listed separately in IPEDS.
Additional locations that are not listed separately have the option of being made "campuses" in IPEDS; a small number of data items are reported for each of these locations, and they are searchable in College Navigator.
Geocodio. 2020. Accessed May 1, 2020. www.geocod.io.
Organization for Economic Co-operation and Development, Consumer Price Index: Total All Items for the United States [CPALTT01USA661S], retrieved from FRED, Federal Reserve Bank of St. Louis. Accessed August 18, 2020. https://fred.stlouisfed.org/series/CPALTT01USA661S
U.S. Census Bureau. 2005 – 2009. American Community Survey 5-year estimates, Median Household Income in the past 12 Months (in 2009 Inflation-Adjusted Dollars); Total population. Accessed September 5, 2020. https://www.census.gov/data/developers/data-sets/acs-5year.html
U.S. Census Bureau. 2006 – 2010. American Community Survey 5-year estimates, Median Household Income in the past 12 Months (in 2010 Inflation-Adjusted Dollars); Total population. Accessed September 5, 2020. https://www.census.gov/data/developers/data-sets/acs-5year.html
U.S. Census Bureau. 2007 – 2011. American Community Survey 5-year estimates, Median Household Income in the past 12 Months (in 2011 Inflation-Adjusted Dollars); Total population. Accessed September 5, 2020. https://www.census.gov/data/developers/data-sets/acs-5year.html
U.S. Census Bureau. 2008 – 2012. American Community Survey 5-year estimates, Median Household Income in the past 12 Months (in 2012 Inflation-Adjusted Dollars); Total population. Accessed September 5, 2020. https://www.census.gov/data/developers/data-sets/acs-5year.html
U.S. Census Bureau. 2009 – 2013. American Community Survey 5-year estimates, Median Household Income in the past 12 Months (in 2013 Inflation-Adjusted Dollars); Total population. Accessed September 5, 2020. https://www.census.gov/data/developers/data-sets/acs-5year.html
U.S. Census Bureau. 2010 – 2014. American Community Survey 5-year estimates, Median Household Income in the past 12 Months (in 2014 Inflation-Adjusted Dollars); Total population. Accessed September 5, 2020. https://www.census.gov/data/developers/data-sets/acs-5year.html
U.S. Census Bureau. 2011 – 2015. American Community Survey 5-year estimates, Median Household Income in the past 12 Months (in 2015 Inflation-Adjusted Dollars); Total population. Accessed September 5, 2020. https://www.census.gov/data/developers/data-sets/acs-5year.html
U.S. Census Bureau. 2012 – 2016. American Community Survey 5-year estimates, Median Household Income in the past 12 Months (in 2016 Inflation-Adjusted Dollars); Total population. Accessed September 5, 2020. https://www.census.gov/data/developers/data-sets/acs-5year.html
U.S. Census Bureau. 2013 – 2017. American Community Survey 5-year estimates, Median Household Income in the past 12 Months (in 2017 Inflation-Adjusted Dollars); Total population. Accessed September 5, 2020. https://www.census.gov/data/developers/data-sets/acs-5year.html
U.S. Census Bureau. 2014 – 2018. American Community Survey 5-year estimates, Median Household Income in the past 12 Months (in 2018 Inflation-Adjusted Dollars); Total population. Accessed September 5, 2020. https://www.census.gov/data/developers/data-sets/acs-5year.html
U.S. Department of Education. 2020. National Center for Education Statistics. Integrated Postsecondary Education Data System (IPEDS). 2008-2009 through 2017-2018. Institutional Characteristics. Accessed February 1, 2020. https://nces.ed.gov/ipeds/use-the-data/download-access-database.
U.S. Department of Education. 2020. National Center for Education Statistics. Integrated Postsecondary Education Data System (IPEDS). 2009-2010 through 2018-2019. 12-Month Enrollment. Accessed February 1, 2020. https://nces.ed.gov/ipeds/use-the-data/download-access-database.
U.S. Department of Education. 2020. National Center for Education Statistics. Integrated Postsecondary Education Data System (IPEDS). 2009-2010 through 2018-2019. Student Financial Aid. Accessed February 1, 2020. https://nces.ed.gov/ipeds/use-the-data/download-access-database.